
|
Last Site Update: April 30th, 2026 | Latest Version: 13.1.0 |
|
|
|
|
|
|
|
|
|
|
|
|
|
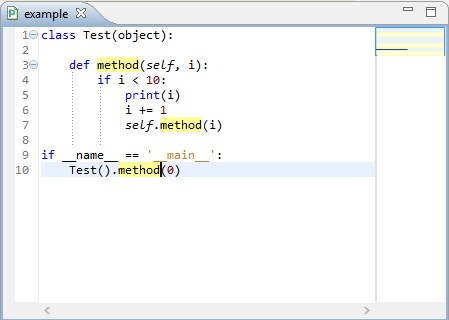
This section is targetted at explaining how to use the debugger. If you want more details on how to use the remote debugger, please check the Remote Debugger page. Ok, probably the first thing you'll want to do is: add a breakpoint to some file and then run the file (and wait for it to hit the breakpoint). To do that, let's start with the example below:
Image: example.py The first thing we'll want to do is add a breakpoint. Let's do that at line 5 (print(i)). There are some ways for adding a breakpoint:
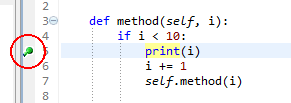
If everything goes ok, you'll have the breakpoint shown in your sidebar (as below).
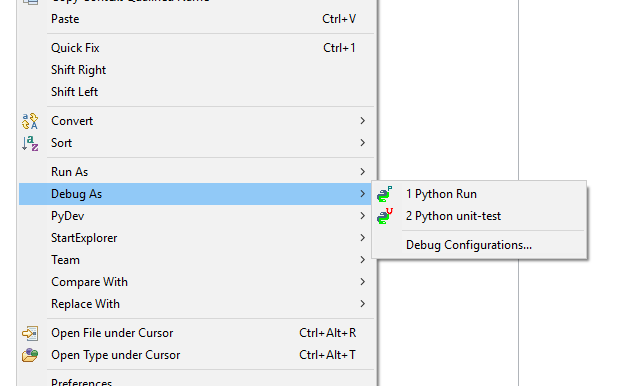
Image: Breakpoint added Now, to debug that file, you can use Shift+F9 (the editor must be focused). NOTE: if you want to re-run the last executed file, you can use F11 to debug it (if you haven't configured F11 to always launch the last launch in debug mode, make sure you read the Getting Started on Running a program).
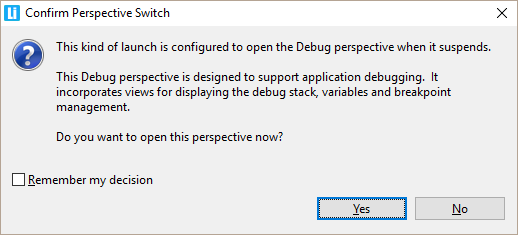
Image: Running the file in the debugger When it hits the breakpoint, it will ask you to go to the debug perspective (you should say Yes to this dialog).
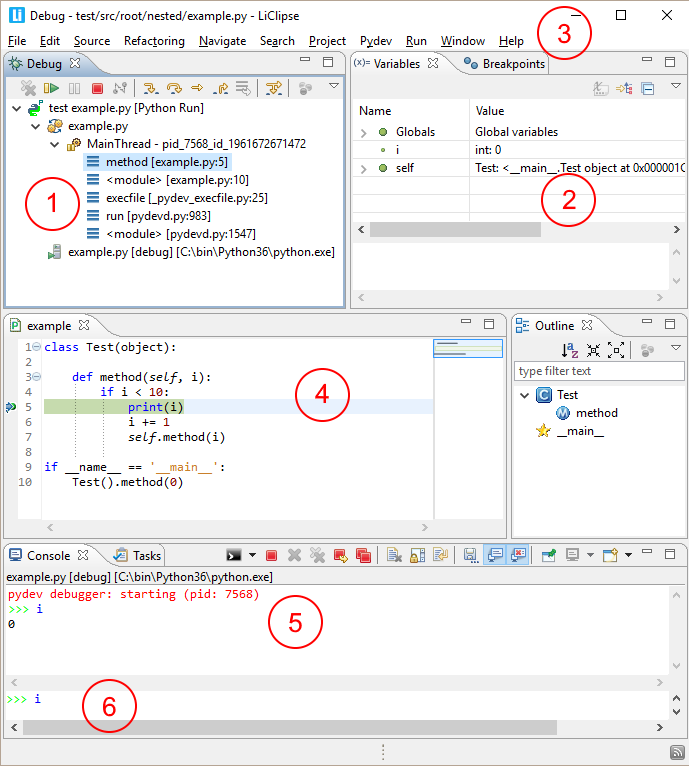
Image: Go to perspective dialog This perspective has the actions needed for debugging and allows you to see the variables and evaluate expressions.
Image: Debug perspective
Now, the basic things you can do in the debugger have some keybindings:
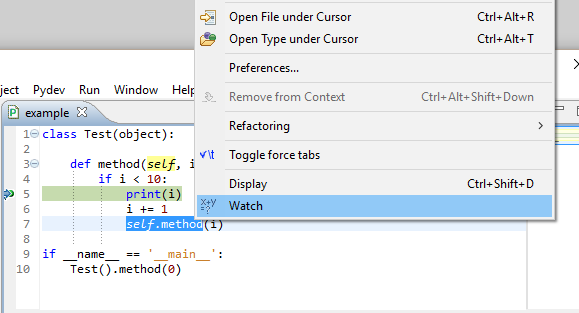
And you can also add a watch for some expression or make the breakpoint a conditional breakpoint. We'll see how this works below. Adding a watchTo evaluate some expression, you can simply select the piece of code you want to evaluate, right-click it and select Watch.
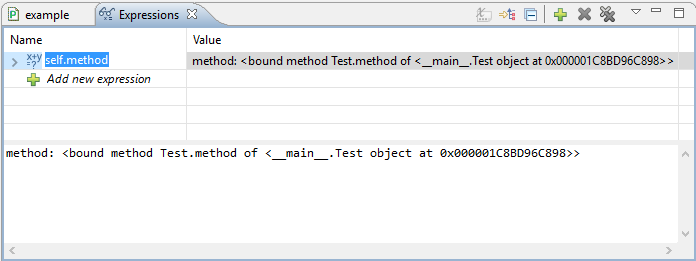
Image: Evaluating expression Doing so will open a new view that allows you to view the result of evaluating that piece of code in the current context. It allows you to edit some existing watch, add a new one or remove an existing (right clicking it provides all those actions).
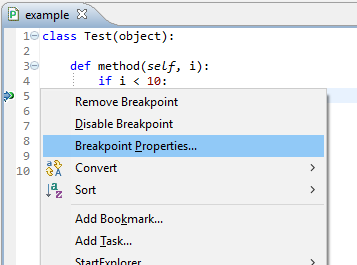
Image: Evaluate Expression view Conditional breakpointsTo make some breakpoint a conditional breakpoint, you have to go to some line that already has a breakpoint, open the context menu Ctrl+F10 and select breakpoint properties.
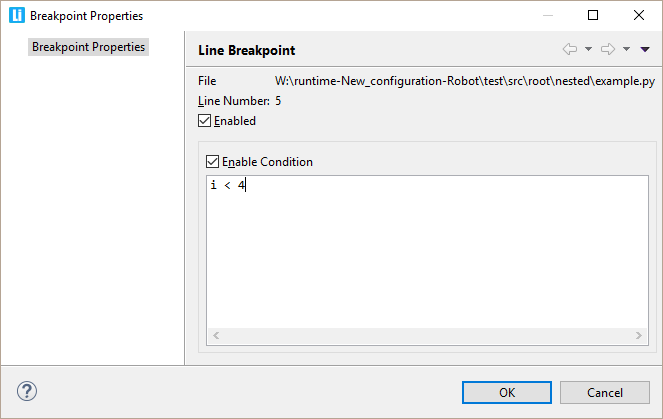
Image: Adding a condition to a breakpoint Doing that will get you to the breakpoint properties panel, where it's possible to enable some condition for the breakpoint to be hit.
Image: Enabling some condition So, now, if you resume execution, it will only hit that breakpoint again when the condition is evaluated to True. What more?Now, on to the Remote Debugger and the Debug Console...
|
PyDev developmentPyDev is open source and depends on your contributions! This may be in the form of bug fixes, answers on stackoverflow, new features...Another option is financially supporting it at: Patreon (which provides a way to support it monthly and get rewards starting with $1). 
Or through 1-time contributions at: Paypal 

Search PyDev-related content |
|
|
|
|
Copyright: Brainwy Software Ltda, 2014-2025 |